
Collateralized Chip Obligations (CCOs)
Tranching the future of AI

Due to LaTeX usage for math equations, this post is truncated. To access the full post, click the title above if you’re viewing this via email.
Back in September 2025 when I published my ‘AI Ouroboros’ piece, I spoke on the circularity of AI investments (hence the title name), and touched on CoreWeave’s GPU-backed debt, albeit briefly. This post will be an expansion of those thoughts. The [extended] thesis I’m exploring is the overarching theme of the rise of securitization in AI, GPU-backed loans and an the birth of a new asset class which I’ll call ‘collateralized chip obligations’ (CCOs) from now on.
ICYMI:


The credit markets will have an increasingly important role in the AI buildout. This post by High Yield Harry explains much of what I’ve been getting at. Since we’re talking about the credit side of the AI buildout, multiple debt markets will be tapped including corporate debt, private credit, and ABS + CMBS to fill the gap.
The slice of the $2.9 trillion pie chart above I’ll be talking about in this piece is the ABS & CMBS tranche (green slice), which is ~$150bn according to Morgan Stanley Research estimates from now until 2028-30.
I’ll admit, I’m not the first to write about GPUs as an asset class as both Marc Rubenstein and Dave Friedman have opened my eyes to it.1 We’re talking about a new asset class, and this started with CoreWeave in mid-2023. Considered one of the first and most prominent examples, CoreWeave raised a $2.3 billion debt facility led by Magnetar Capital and Blackstone, using their existing Nvidia H100s as collateral to purchase more H100s. Then Crusoe Energy Systems did the same later that year which is interesting as they pivoted from a crypto mining to an AI cloud computing company. The most recent iteration of chip-based ABS is with Lambda Labs. In early 2024, they secured a $500 million loan, described as a “first-of-its-kind” GPU-backed asset-backed securitization (ABS), led by Macquarie Group, using their Nvidia chip inventory as collateral. Fast forward to the present day, Lambda also entered into a significant $1.5 billion deal involving renting back thousands of Nvidia chips. There have been a lot more chip-backed loan CCO deals since then.
The Mechanics of GPU ABS

In this section, I’ll walk the reader through a rough idea of the mechanics with some maths. I’ll provide a working example using AltStreet’s published numbers as well as other sources like S&P Global and others. It’s worth noting the math is stylised.
Basic assumptions will be used to help the reader get a sense of how this works. I’ll assume an AI infrastructure provider owns 1,000 Nvidia H100 GPUs and wants to finance them via a GPU-backed facility that will later be securitized.2
Key market inputs (within published ranges):
New H100 80GB purchase price: $35k-$40k per GPU
Secondary “fair market value” (FMV) today: $25k-$30k per GPU
Orderly liquidation value (OLV): $20k-$25k per GPU (assumes 30–90-day sale).
Base advance rate (a): 50-60% of OLV, rising toward 70% for strong rental contracts and customers.
Senior loan pricing: SOFR (3.65% as of 12th March 2026) + 400-700 bps, ranging from ~7.5-12% all in.3
Typical term: 2-4 years with 20-30% annual depreciation to match rapid GPU depreciation
Step 1: Collateral valuation and borrowing base
Number of GPUs: N = 1,000
New price per GPU: Pnew = $40,000 (upper end of $35k-$40k band).
Orderly liquidation value [OLV] per GPU: POLV = 20,000 (lower end of $20k-$25k, a conservative assumption)
Advance rate: a = 60% (midpoint of 50%-70% typical range).
Formula 1 – Collateral OLV:
Collateral OLV = N × POLV
Plugging it in:
Collateral OLV = 1,000 × $20,000 = $20,000,000
So the lender treats the 1,000 GPUs as having a conservative liquidation value of $20m.
Formula 2 – Maximum borrowing base:
Borrowing Base = Collateral OLV × a
Borrowing Base = 20,000,000 × 60% = 12,000,000
The senior GPU can be sized at 12 million (a 60% LTV on OLV, and an even lower ratio on the original cost).
Step 2: Loan terms, interest and scheduled amortization
We’ll take a straightforward senior term loan consistent with current GPU facilities:
Loan principal at closing: L0 = $12,000,000
All-in interest rate: r = 9.15% (within of 7.5-12% band for senior GPU loans, based on SOFR of 3.65%)
Term: 3 years (midpoint of 2-4 years depreciation)
Amortization: 25% of original principal per year (midpoint of 20-30% annual depreciation)
Now I’ll define the annual scheduled principal repayment:
Annual Principal Amortization = a × L0
with a = 25%, so:
Annual Principal Amortization = 0.25 × $12,000,000 = $3,000,000
Then the principal schedule:
At End of Year 1:
L1 = L0 – $3,000,000 = $9,000,000
At End of Year 2:
L2 = L1 – $3,000,000 = $6,000,000
At End of Year 3:
L3 = L2 – $3,000,000 = $3,000,000
Interest each year (assuming simple, not exact day count):
Year 1 interest: 9.15% × $12,000,000 = $1,098,000
Year 2 interest: 9.15% × $9,000,000 = $823,500
Year 3 interest: 9.15% × $6,000,000 = $549,000
Total scheduled debt service:
Year 1: $1,098,000 interest + $3,000,000 principal = $4,098,000
Year 2: $823,500 interest + $3,000,000 principal = $3,823,500
Year 3: $549,500 interest + $3,000,000 principal (plus any bullet) = $3,549,500+
GPU rental contracts must be sized in a way that enables cash flow comfortably covers this; lenders usually require a DSCR of at least 1.3-1.5x based on these scheduled payments, reality will likely reflect different numbers.
Step 3: Depreciation and LTV over time
Now we can bring in economic depreciation from the GPU side. AltStreet’s reference curves for H100 show something like:
Purchase price: P0 = $40,000
Year 1 value: P1 = $28,000
Year 2 value: P2 = $18,000
Year 3 value: P3 = $12,000
Formula 3 – collateral value by year:
Vt = N × Pt
So:
Year 0 FMV:
V0 = 1,000 GPUs × $40,000 = $40,000,000 FMV
Year 1:
V1 = 1,000 × $28,000 = $28,000,000
Year 2:
V2 = 1,000 × $18,000 = $18,000,000
Year 3:
V3 = 1,000 × $12,000 = $12,000,000
Formula 4 – LTV over time (on a FMV basis):
Using the principal schedule from step 2:
Year 0:
Year 1:
Year 2:
Year 3:
As Brian DeChesare notes, the real issue in the AI CapEx debate is not whether Big Tech is using 3‑, 4‑ or 6‑year useful lives for GPUs, but the relationship between depreciation, replacement CapEx and the incremental cash flows those assets actually generate. Accounting choices can shift reported earnings, yet on a cash basis the key question is whether the very high AI CapEx ever produces enough durable revenue to justify constant reinvestment. That same tension sits inside GPU ABS: structures can treat accelerators as multi‑year “long‑term assets” for modelling purposes, but if economic life is closer to 2–3 years and the cash uplift disappoints, both the equity in the data centre and the bonds backed by its GPUs end up exposed to the same mis‑estimated useful lives. These aren’t “set-and-forget” ABS as they require ongoing vigilance, a grasp of tech trends, and possibly active involvement (in monitoring or workouts).
Even as GPUs depreciate rapidly (roughly 55-70% over 3-4 years in historical examples), amortization keeps the LTV on current market value roughly flat or improving in some cases. If the principal paydown does not keep pace with GPU value decay, the loan can end up “underwater” even if cash flows are sufficient to cover payments.
Step 4: From loan to ABS tranche
Suppose the $12m loan (or a pool of similar loans) is securitized into:
Class A (senior notes): 80% of deal size
Class B (mezzanine): 20% of deal size
Equity: residual claim on excess spread and collateral
Formula 5 – Tranche sizes at closing:
Let the total collateralized loan balance into the SPV be L0 = $12,000,000.
Class A = 0.80 × L0 = $9,600,000
Class B = 0.20 × L0 = $2,400,000
For simplicity, I am treating the equity as the originator’s residual interest in the collateral above the $12m loan rather than an issued note. In reality, many GPU financings have explicit equity/subordinated notes and over-collateralization such that total collateral value exceeds note balance by a further 10-20%.
Step 5: Recovery math in base and stress scenarios
As AltStreet provides reference recovery assumptions for GPU collateral, I’ll use their numbers to help illustrate what loan recovery could look like in various scenarios:
Base-case orderly liquidation: 70-80% of FMV, after 90 days
Downside (distressed market): 50-60% of FMV, after 180 days with multiple sellers.
It’s also worth noting that recovery math is not applicable from day 1 as facilities do not face stress immediately. I’ll run this on year 2 [assuming a 3-year depreciation cycle] as the depreciation of GPUs will usually face stress around mid-life. At Year 2 we had:
Principal outstanding:
L2 = $6,000,000
Collateral FMV:
V2 = $18,000,000
Since Class A is 80% of the capital structure, its outstanding balance is:
Class A outstanding at Year 2 = 0.80 × $6,000,000 = $4,800,000
Base case – 75% recovery on FMV:
Gross Liquidation Procceds = 0.75 × V2
Gross Liquidation Procceds = 0.75 × $18,000,000 = $13,500,000
I’ll assume 10% costs for various fees (legal, transport, broker, etc), staying consistent with AltStreet’s 10-15% range:
Net Procceds = $13,500,000 × 0.90 = $12,150,000
DSCR ratios:
vs. total loan L2 = $6,000,000
vs. Class A only (I’m assuming outstanding Class A is proportional)
Based on prior math, even in a benign liquidation scenario the senior ABS would look safe; even the mezzanine would have some coverage. For senior ABS to look bad, the recovery rate on FMV would have to be substantially lower, we’re talking < 50%
Now the downside case – 55% recovery on FMV:
Gross Liquidation Procceds = 0.55 × $18,000,000 = $9,900,000
Because this is a downside scenario, the outlook will be more pessimistic. I’ll apply 15% costs (the upper end of 10-15% fees):
Net Procceds = $9,900,000 × 0.85 = $8,415,000
DSCR ratios:
vs. total loan L2 = $6,000,000
vs. Class A only (I’m assuming outstanding Class A is proportional)
If the downside case is a 50-60% recovery, senior ABS notes would still model as money-good; the first losses are borne by equity and mezzanine before hitting both junior and senior ABS notes. This math explains the logic used to justify tight spreads on senior GPU ABS.
OC Cushion at Year 2 = Net Proceeds - L2 = $8,415,000 - $6,000,000 = $2,015,0004
which is a ~40% buffer over the outstanding principal in year 2.
To expand on what I said previously, for the math to look catastrophic in a bearish scenario, the recovery on FMV in an extremely distressed scenario would be around 30%. And if that did happen then DSCR ratios [even for senior ABS] would be below 1x. People will start asking questions, and PE/PC funds as well as banks underwriting GPU ABS will start to offload these things. Even a recovery of 40% of FMV is still questionable.
Market Growth

The data centre ABS graph above mainly refers to the US as that’s where most of the buildout is taking place. The US lead the data centre securitization market substantially and first entered the market in February 2018 with a $900m Vantage Data Centre transaction. From 2018-2020, the adoption was slow as less than 5 issuers emerged during that period. 2021 was a breakthrough year, and as of 2025 the market has matured a lot with $25bn in annual issuance.
Europe got into the game 6 years later. In 2024 Vantage also completed a £600m securitization deal, followed by another €640m transaction in Germany.
As profiled in the funding mix pie chart above, asset-backed securities (ABS) transactions are just a small part of the overall ~$3tn projected capex spend. Out of the $150bn in ABS & CMBS, there was a ~70/30 spilt in favour of ABS with CMBS representing just 30%, according to RBC. They also note that this has shifted and the mix is now closer to 50/50 due to issuers successfully accessing both markets in order to finance their growth.

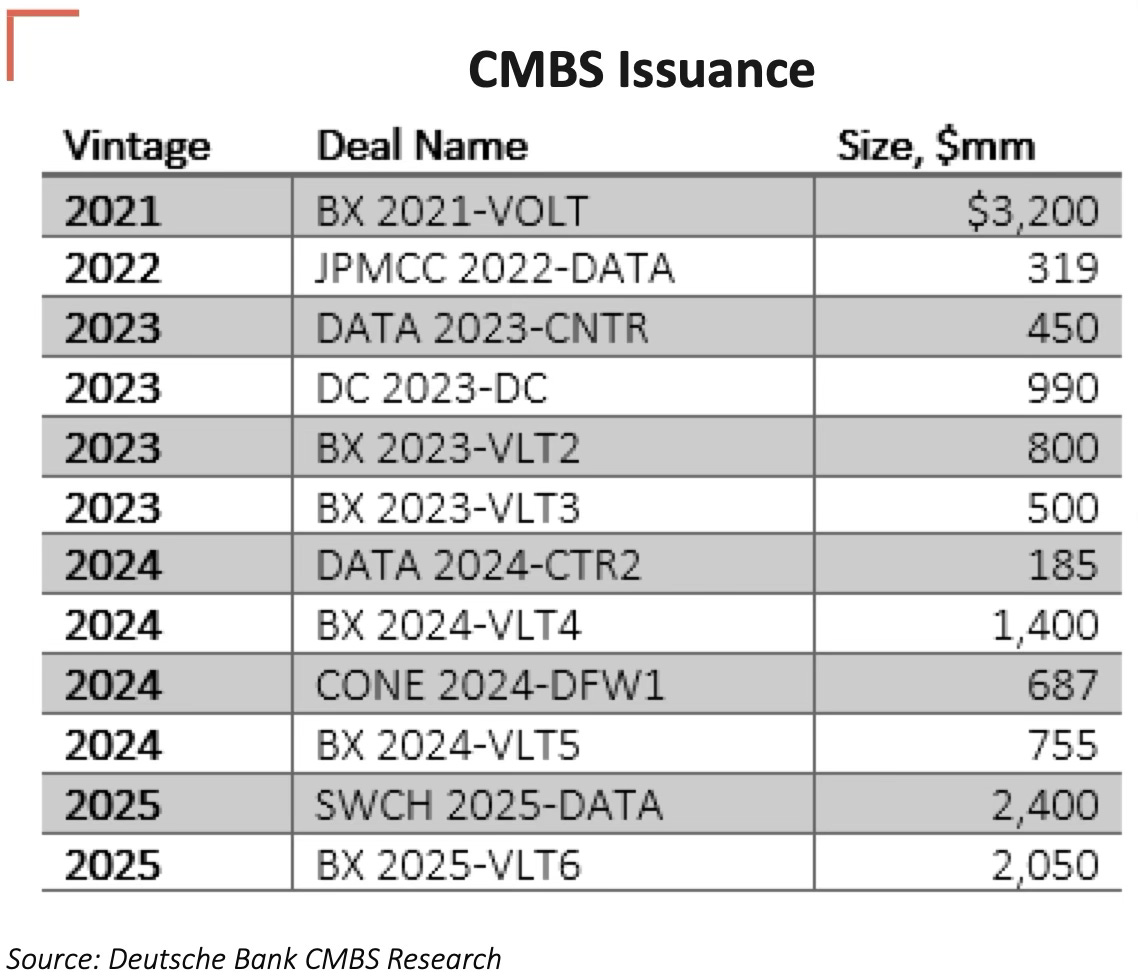
An example of CMBS being used is Blackstone-backed QTS Data Centers refinancing $2bn in CMBS notes. Data center CMBS (commercial mortgage-backed securities) provide financing by bundling loans secured by data center properties into bonds sold to investors. Unlike ABS, which is backed by lease revenue, CMBS relies on real estate mortgages. The process begins with mortgage origination, where data center operators take out loans secured by their facilities. These loans are then pooled into CMBS trusts, with bonds issued to investors who receive payments based on mortgage debt repayments. Unlike traditional commercial real estate, data centers house mission-critical tenants with strong renewal rates, reducing default risk. Additionally, single-asset, single-borrower (SASB) CMBS deals - structured around a single, high-value data center asset - are becoming more common, allowing large institutional investors to gain targeted exposure to premium data center properties.
Risks + Bubble Signals
Venture debt is entering a new frontier, and with that comes new risks.
GPU-backed lending and securitization typically advance 50-70% of an appraised “fair market value” against the hardware with terms of 2-4 years and covenants tied to periodic revaluations. Structurers will then securitize this and tranche the exposure. Senior notes sit at the top, then equity and mezzanine tranches will follow, plus residual value guarantees (RVG) or insurance, making headline LTVs on the senior paper look conservative.
From the bond investor’s vantage point, the structure emphasizes:
Hard collateral with serial‑number tracking and perfected liens.
High initial LTV cushions and cash sweeps from GPU rental contracts.
Modeled stress scenarios showing senior tranches covered even if collateral takes, say, a 40–50% hit.
It’s also worth revisiting a note [which I didn’t include in my conduit debt financing primer] on Meta’s RVG I published on November 3rd 2025:
A good example of how strange this can get is Meta’s roughly 30 billion dollar Hyperion joint venture with Blue Owl, where an SPV (Beignet Investor) issues about 27 billion of A+‑rated bonds to fund a data‑centre Meta will then lease back. Rather than giving noteholders a clean first‑lien on the assets and a straightforward rent guarantee, the structure routes support through a Master Value Guarantee and a Residual Value Guarantee that run between Meta and a holding company above the issuer, leaving bondholders structurally subordinated to whatever other liabilities that vehicle might accumulate. S&P itself flags the RVG set‑up as “unique,” which in structured finance is rarely a compliment. I’d want to see the Blue Owl–Meta shareholder agreement, understand why there are eleven separate leases and whether they are co‑terminous, and map out exactly how and when the RVG can be triggered, partially triggered, or transferred. My worry is that if AI demand disappoints, recoveries on these notes could be far lower than the models imply, because investors lack direct security over the campus and must rely on complex, off‑balance‑sheet guarantees while Meta quietly stacks up a portfolio of long‑dated, correlated contingent obligations that almost no one is treating as leverage.
As long as AI demand is rising and new capital is available, refinancing maturing facilities or rolling ABS shelves can mask how quickly the underlying hardware is aging out, because investors focus on headline utilization and cash flows, not the shrinking residual value per chip.
The issue is those structures usually rely on modelled depreciation curves and assume ongoing liquidity in secondary markets for “last‑gen” GPUs (inference, lower‑tier workloads) to justify residual values several years out. If real‑world tech progress or demand shocks push actual value paths outside those curves - e.g., a faster‑than‑expected shift to radically more efficient architectures - losses can blow through equity and mezzanine much faster than the models implied, surprising senior investors who thought they were remote from tech risk.
As Kakashii wrote in a note on 14th March 2026:
The market has apparently convinced itself that GPUs [de]-appreciate on a schedule favorable enough to underwrite dozens of billions in collateralized debt. GPU-backed facilities are oversubscribed. Blue Owl, BlackRock, JP Morgan, Goldman Sachs, Apollo, and the rest are lining up.
They are pricing certainty into an asset class that has no long-term price discovery, no liquidation history at scale, and a supplier who controls both the roadmap and the obsolescence curve.
I would be short every one of these deals.
The obsolescence curve is the most noteworthy point regarding GPU securitization risk. Your average person replaces their hardware every 3-5 years if they’re using it for work purposes and/or some additional lower-tier workloads, whereas a gamer [or anyone with more intensive workloads] will end up replacing their PC closer to every 2-3 years. Sure, one can make the argument that desktop GPUs aren’t quite the same as AI-focused GPUs but the point about higher intensity workloads and GPUs as an asset obsoleting quickly still remains. Also, Nvidia are upgrading to yearly cycle rhythms. They’re securitizing GPU like mortgages on a house, I’m not too sure where the certainty is here. GPUs like the H100 can deliver amazing performance but will that performance continue for 3, 4, 5 or even 6 years from now? In light of Nvidia’s GTC event - which is happening as I publish this - the Groq LP30 announcement is actually insane. There’s essentially little competition to Nvidia anymore for hardware AI training, and especially inference (besides Google’s TPUs). As of now, they’ve got the biggest imperium no one can match. 5
I also stated in AI Ouroboros the “GPU demand is self-subsidised.” Lending to CoreWeave and Lambda and Crusoe could be lucrative but they all correlate to the same sector and all use Nvidia’s GPUs, so there is a possbility of systemic risk if AI compute demand as a whole falters or Nvidia hits a snag.
If (or when) any of the three things happen together:
next‑gen chips deliver a large performance‑per‑watt jump
secondary demand for old cards saturates,
credit conditions tighten
The assumptions baked into GPU ABS structures can fail all at once if RVGs are breached, advance‑rate covenants trip, and refinancing options evaporate. In that scenario, neocloud and AI infra operators with weak profitability and high GPU‑backed leverage (exactly the borrowers Jim Chanos has warned about; CoreWeave & Applied Digital, I’m looking at you) face defaults, forced asset sales into a thin secondary market, and sharply wider spreads on any new GPU ABS - choking off capital to the entire AI build‑out.
Future Outlook
Chip‑backed securitisation is simultaneously an elegant workaround for today’s AI capex bottleneck and a potential accelerant of tomorrow’s unwind.
On one hand, turning GPUs into collateral has channelled billions into AI infrastructure that traditional balance sheets and project‑finance models struggled to support, helping bridge the gap between modest AI revenues and an infrastructure bill that runs into the hundreds of billions. It showcases how structured finance can repackage short‑lived, supply‑constrained hardware into investment‑grade paper, attracting pension and insurance capital into an asset class that barely existed a few years ago.
On the other hand, history suggests that when novel, hard‑to‑value assets are securitised at speed in a euphoric market, underlying risks including rapid GPU obsolescence, aggressive refinancing assumptions and layered off‑balance‑sheet guarantees tend to be underpriced until a shock forces everyone to reprice them at once. If AI workloads and Nvidia’s dominance keep compounding, the structures will look like a stroke of financial engineering genius; but if compute demand or pricing stumbles, the very features that made GPUs attractive collateral [such as high concentration of value and short economic life] could make these deals a focal point of the broader AI financing bust.
Further reading:
GPUs as collateral (@elongated_musk on Medium - has multiple posts on GPU securitisation)
CoreWeave and the never-ending GPU depreciation — A Masterclass in Accounting Elasticity (Kakashii’s Materials on Substack)
Data centre financing: A European persoepctive (Norton Rose Fulbright)
ABS for European digital infrastructure - what’s next? (Clifford Chance)
Insights: the AI bubble (Man Group)
Bubble or nothing (Centre for Public Enterprise)
Dave Friedman has multiple posts talking about GPU financialization.
GPU orders are usually above 100,000 and in some cases above 1,000,000.
GPU-backed loans can have all-in interest rates (SOFR + spread) as high as 15%. This reflects startup risk & technological risk; they’re also unrated in some cases. AltStreet states 8-12% all in interest rates based on a SOFR of 4%.
OC = over-collateralisation
If you want to understand the rationale behind the Nvidia/Groq acquihire, read ‘Who Captures the Value When AI Inference Becomes Cheap?’
Until next time,
Les
For clarification, I'm not implying that GPU-backed loans are the thing that causes 2008 to happen again just because (a) of the title and (b) me using a picture from the Big Short in the preview - that'd be a reach. What I am doing is using math to try to help explain the rise of GPU securitisation, and the risks it may present *if* the assumptions do not hold. As of now, assuming recovery ends up 60% or above then using GPUs as collateral is fine, especially if we're talking about senior secured loans (which most of them are).
If reader(s) want to believe this is 2008, then that's on them. I'm not writing this to influence people's views.
The structure looks solid.
The assumption underneath it matters more.
GPUs aren’t stable collateral.
They’re on a replacement cycle.
That’s the risk.